
Data analysis, along with driver feedback, is one of the most valuable tools when both optimising the setup of a race car, and also improving the performance of drivers. There could be hundreds of sensors on a race car, picking up data such as driver inputs (throttle, brake, steering), ride heights, suspension geometry, temperature sensors, longitudinal and lateral forces, wheel speeds, the list goes on and on! The information from these sensors are collected, stored and analysed (sometimes even whilst the car is still out on circuit). From these data points, engineers can make assumptions about the behaviour of the car at any period of time, and then evaluate whether or not the car is performing at its maximum potential.
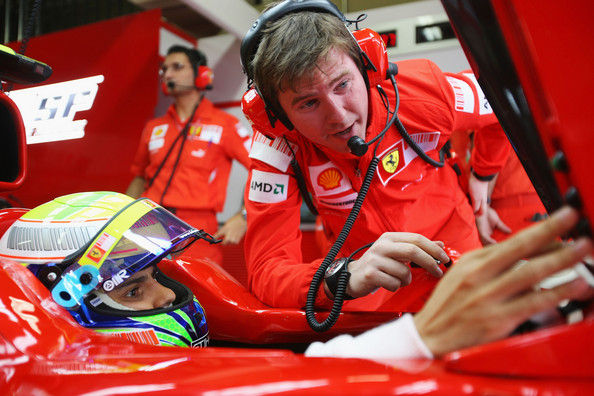
Here's a picture of Felipe Massa, going through some data as he is in the pitlane with a lead data engineer. This image has been taken from racingcardynamics.
The data collected from these sensors are recorded, and are analysed in specific software. An example of such software is shown below.

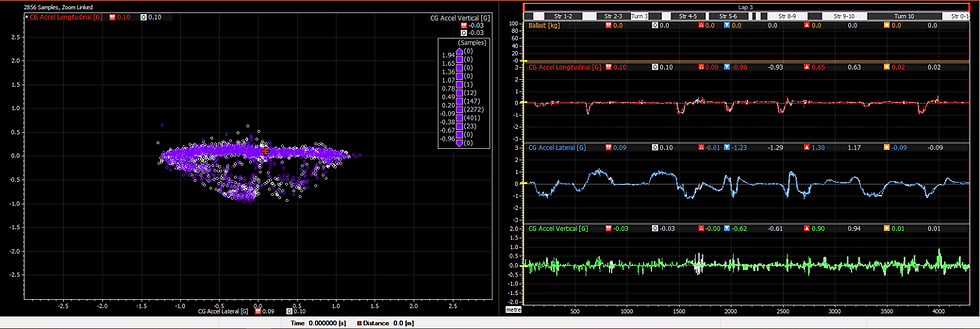
Using this software, you can have many different pages that show different plots, some include data such as track position to assist identifying different corners. Above is what a page of data may look like. It includes some basic traces in the middle of the screen, such as throttle and brake position, steering angle and speed. On the right (top) you can see a graph showing lateral accelerations throughout the lap, with a map of the track sitting below.
You can also introduce new plots based on mathematical functions of sensor data. For example, a basic understeer/oversteer plot can be generated by analysing the difference in slip angles between the front and rear wheels, seen on the bottom of the image above.
A huge amount of data is generated when a data-logging system is being used, even just for one session. All the sensors have to operate at extremely high frequencies, to generate very accurate and precise data that can be used to analyse the performance characteristics of the car.
A recent study by AWS showed that from the 120 sensors on each Formula 1 car, 1500 data points are generated every second, accounting to 3GB worth of data. Over a race weekend, multiple terabytes of data are collected through these sensors, and all this data gets analysed both at the track and back at their factories. This also means they even have to have incredibly large and complex networking systems to send such a large amount of data long distances, in real time. You can learn more about how AWS is handling, optimising and analysing all this data here.
Now the key to the data plots is knowing how to read and understand them correctly. Some sensors will be designated for looking at the performance of new parts. For example, there may be some air-speed sensors over aerodynamic elements of the car, along with pressure sensors in order to analyse the performance of a new aerodynamic package.
One use for all the data is to optimise the setup (you can find more about the basics of race car setup in my blog post here!) of the race car. The data can tell trackside engineers exactly how the car is reacting in almost every way imaginable, at each section of the track. Whilst the driver is likely to give good feedback on the balance of the car in a debrief session, the extractable data from sensor plots is invaluable information, that can pick up if certain systems in the car are not working as efficiently as possible.
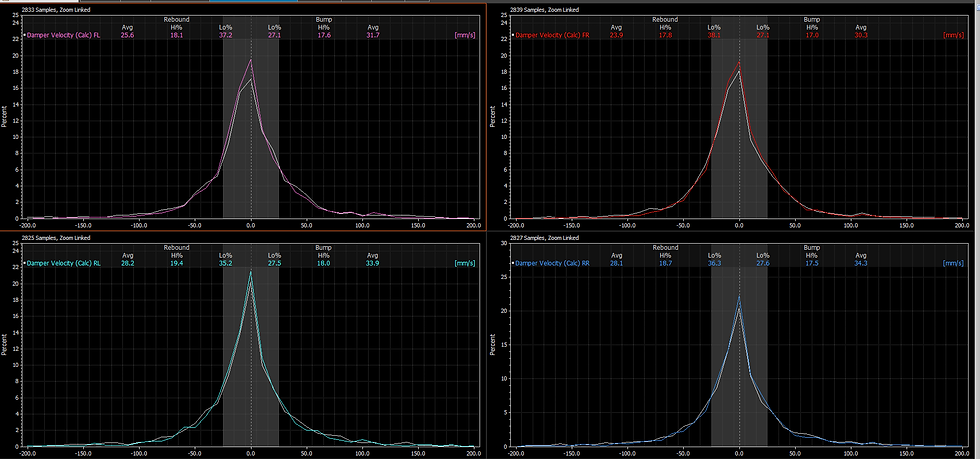
Once example of this is Damper histograms, which are a method for displaying the duration a damper spends at piston speed ranges. This gives insight into the performance of the damper across a race stint.
Ride height sensors can be used to determine how much a chassis is rolling (rotating about the centre line through the car) whilst cornering. By also measuring the compression of the suspension springs through cornering, parameters such as the tyre deflection can also be calculated. These plots can be expanded further to find the roll angle ratio for the chassis, giving incredible insight into the roll stiffness distribution of the whole system. Targeted setup changes can then be planned and performed in order to mitigate any issues that may have been seen at any stage of this process.
These examples and more are explored in more depth at racecar-engineering.
Another key use of data-logging and telemetry systems is to optimise the performance of the drivers. By capturing driver inputs such as throttle, brake and steering angle, you can compare how different drivers go around the circuit by their differences in inputs. Alongside this, the live differences in their lap time can be displayed, which can give an indication for which driver is faster or slower through particular corners of the track. The slower driver can then adopt the technique of the faster driver through those sections in order to enhance their own performance. For example, a driver may see that their teammate is braking later than them in to a particular corner, and is carrying more speed at the apex of the corner (a larger minimum apex speed). The slower driver can analyse exactly how much time he has been losing to their teammate in that particular corner, and adjust their technique accordingly.
This is an example trace of two different drivers. Whilst the traces have different colours, for each trace, there is also a white line behind it. This indicates the data from the second driver, enhancing the visibility of the difference between the two. The 'delta' (or 'variance'), the differences in their lap time, are also displayed as a separate trace, the white line at the top of the page. As you can see, the delta changes as you progress through the lap. A rising line on the delta page gives you can indication that the first driver (the driver with all the coloured traces) is going faster than the second driver (who has all the white traces). As the delta line goes down, the second driver has gained time on the first driver. By the end of the lap, the second driver has gone about half a second slower than the first driver.
It's in these plots where drivers can evaluate their own performances and learn from their teammates. For example, the slower driver can see through the data that the faster driver may have a smoother, more progressive steering input through a particular corner. The faster driver can still learn from this data though, as you can see there are a couple of corners where the second driver is faster, so adjustments can then be made accordingly.
Data analysis has become increasingly prevalent in modern motorsport series, with teams and championships having a large number of dedicated engineers and analysts who manually crawl through the data, and extract as much performance as possible from the car. As the technical revolution continues to flourish in all avenues of life, artificial intelligence is storming into the world of motorsport, with complex learning algorithms starting to be used to optimise both driver and vehicle performance. Whilst the usage of these systems is not yet widespread, and teams will undoubtedly continue to employ hundreds of incredibly intelligent specialist data engineers, questions are being asked about what the future looks like for the role - time will tell if machine will render manual review obsolete.
Comentários